一份数据挖掘报告 - 来自ANU的课程作业
这是我在ANU最后一学期的数据分析课(COMP8410/3425)的最终报告,分析一份调查问卷,有一些很有意思的东西,成绩也还不错,如果不算语法错误的扣分就优秀了。
Data Mining on different gender’s attitude towards data utilisation of public authority – using ANUPOLL2018DATA
1 Introduction
This report is trying to find out the different attitude between the males and females towards the topic of data utilisation of public authority by using the techniques taught in COMP8410 course like associate mining, linear model and clusters etc and it would use the ANUPOLL2018Data [1] as the data source. Basically, the project would use Rattle for the mining task and python with pandas to do the data pre-processing. In the beginning, we may assume that there may be no significant difference on the attitude or trust towards the public authority at the aspect of data utilisation and information security between these two genders.
2 Data description and pre-processing
2.1 Data description
This report would use the original version of the ANUPOLL2018Data, a result of a poll and the source can be found in [1]. The original dataset contains 134 attributes and 2150 rows of data. Generally, those attributes could be classified into the following groups.
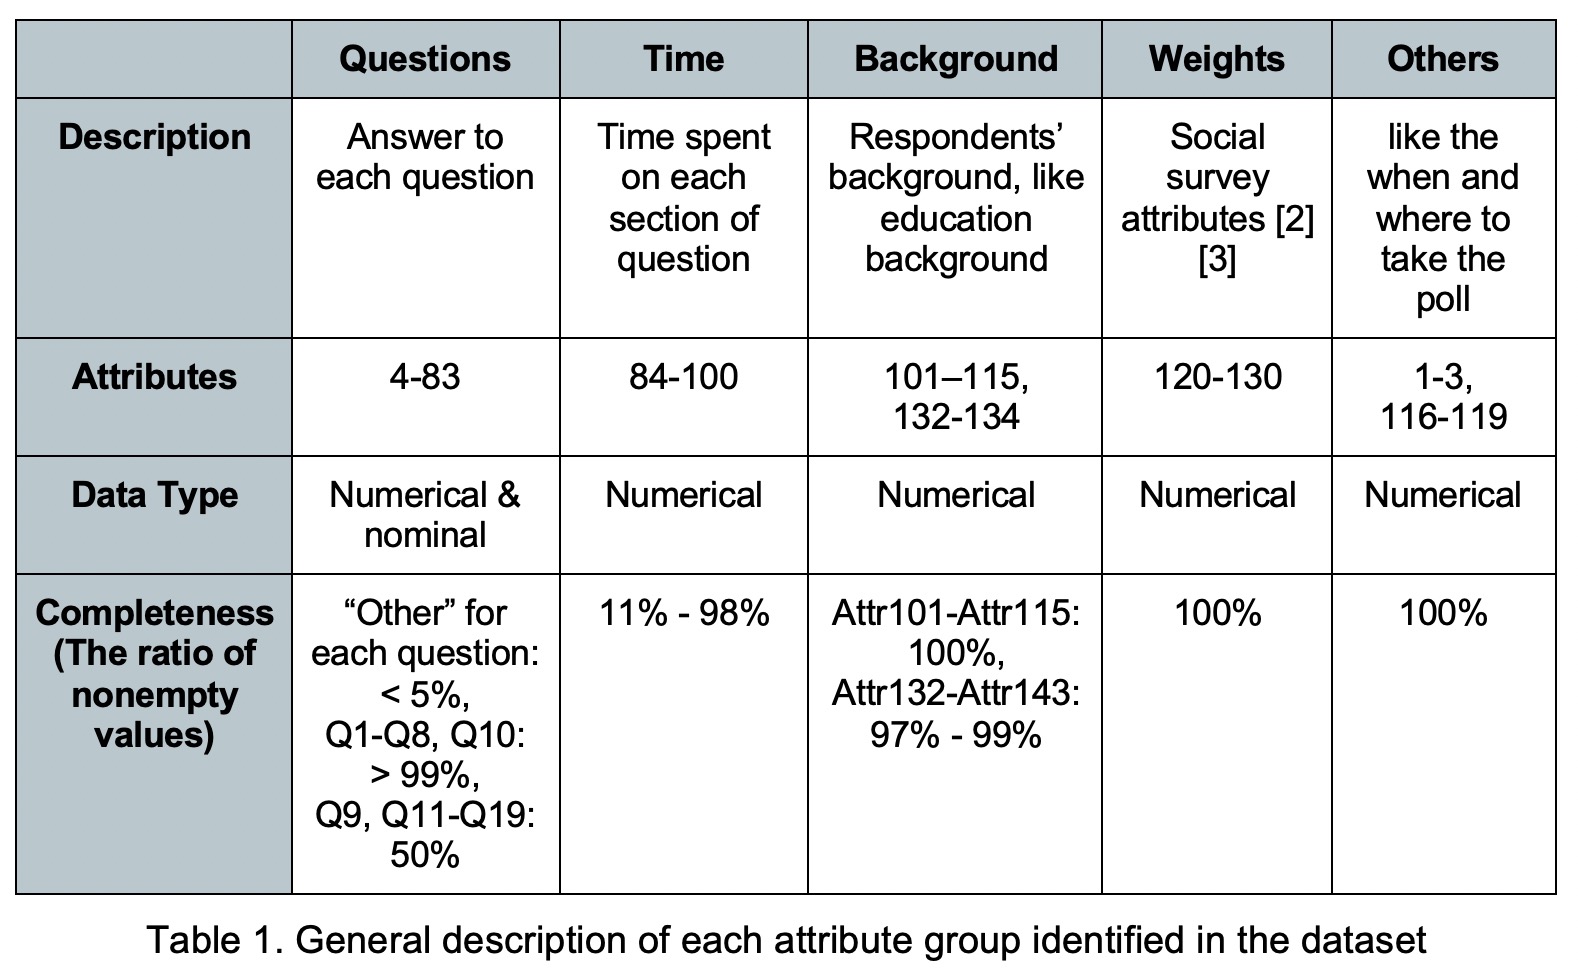
Data reduction
Only a small set of attributes would be used. The attributes like “Q1_oth” would be removed since they have very low completeness. Besides, since the topic is to study the people’s attitude towards data utilization, the question unrelated to this topic like Q1-Q4, Q16-Q19 and those related to “clicking” the link would also be eliminated. Moreover, attributes with single restricted value “-99” like “p_region” would also be removed since they have no use to group people. In this report’s context, I care only about people’s answers to each question. Therefore, attributes describe how much time used, those weights and what platform used for collecting the data would also be eliminated. In the end, 52 attributes remain. Such steps are done by Rattle “cleanup” within the Transform panel.
2.3 Data imputing and recoding
For the attributes with less than 50% missing values, the mode of such attribute would be used for imputing. For the attributes with more than 50% missing values, an “nan” would be imputed since inserting with a statistical number may affect the final results. Besides, all the questions and background information would be transferred from numerical data into categorical type because the numerical value for a question is a code of a text option hence categorical type. All operations above are done under the transform panel of Rattle, one is imputing and the other is recoding.
2.4 Data integration
To study the reaction towards the poll of a different group of people, this section would use python with package pandas to count the type of reaction (the nominal value of each question) of each person and generate several new attributes. Those attributes include the count of refused, unknown, strongly against, neutral, against, agreed, and strongly agreed. The methods to generate attributes like agree and very_agree in 3425.csv is also used here.
3 Associate mining
3.1 Overall strategy
Generally, this report would classify the questions into different topics. According to the data dictionary [1], Q5-Q7 are related to the government, Q8 and Q11-Q14 are related to the institution, and Q10 are related to consumer data right. Therefore, the following experiments would be operated by those topics. Besides, since the aim is to find out whether there’s a relationship between the reaction of different groups of people, the project would not only do mining on the relationship of each question but more focus on mining the relationship between those questions and people. Therefore, when running the model on Rattle, the people group attribute “p_gender_sdc” would always be selected to see whether there is a relationship between question and gender. Besides, attribute “p_state”, “p_age_group_sdc” and “p_education_sdc” would also be kept, which aims to find out whether there are more interesting patterns with the gender. Besides, since this explores the patterns in the whole dataset, no partition would be used.
3.2 Mining on attitude towards the data utilisation of the government
In this section, Q5-Q7 and people group attributes would be selected as input and the other attributes would be ignored. Firstly, the support and confidence are set to 0.15 and 0.8 for mining. The mining returns 217 rules. Generally, the mining results illustrates that the answers are strongly consistent, people are more likely to provide the same answer for each question. The mining result concentrates on Q5 and it shows that there is some relationship between the answer and different people. For example, the result in Figure 1 (a) shows that the male (the right cluster) are more likely to answer 1 to each part of Q5, which means they have a higher expectation than female on the government’s ability to deliver services to the public.
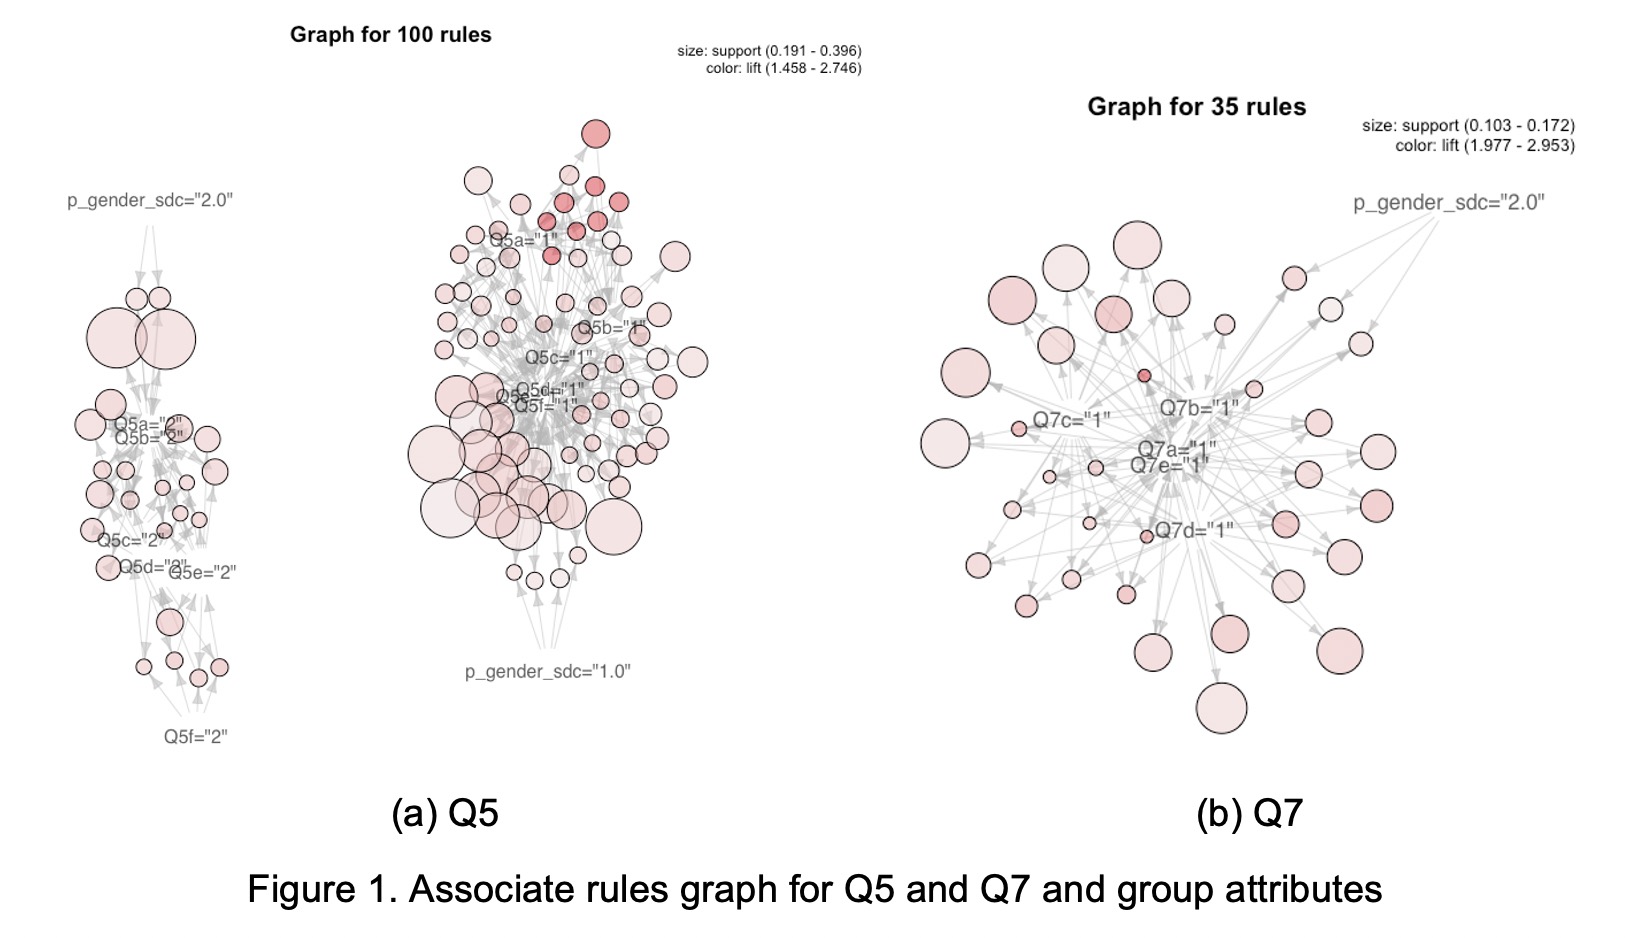
To find out more patterns related to Q6 and Q7, the Q5 is removed from the input while Q6 and Q7are tested separately. Unfortunately, the mining for Q6 is unsuccessful since no rules are returned even setting the support to 0.1. If the support of the rule is less than 0.1, it means the rule may lack sufficient evidence [4], thus not considered in this report. The situation is better for Q7, where the support is set to 0.1, and confidence is set to 0.8, and it returns 35 rules and its graph is shown in Figure 1 (b). This graph also illustrates that the answer to each question has a relationship with gender. The females have the strongest concern about whether their data would be misused or accidentally exposed by the government. In other words, they are more unconfident about the government.
3.3 Mining on attitude towards the data utilisation of the institution
In this section, Q8, Q12-Q14, and people group attributes would be selected as input and the other attributes would be ignored. In the beginning, the mining is unsuccessful since the Q12-Q14 has nearly 50% missing values and all of them have been previously imputed “NAN”. As a result, most rules returned by the initial mining are related to “NAN”. To decrease its effect on associate mining, another step of data pre-processing has been taken to remove all observations with missing values. As for parameters, the support and confidence are set to 0.2 and 0.8. The result generates 43 rules, the graph for those rules is as below,
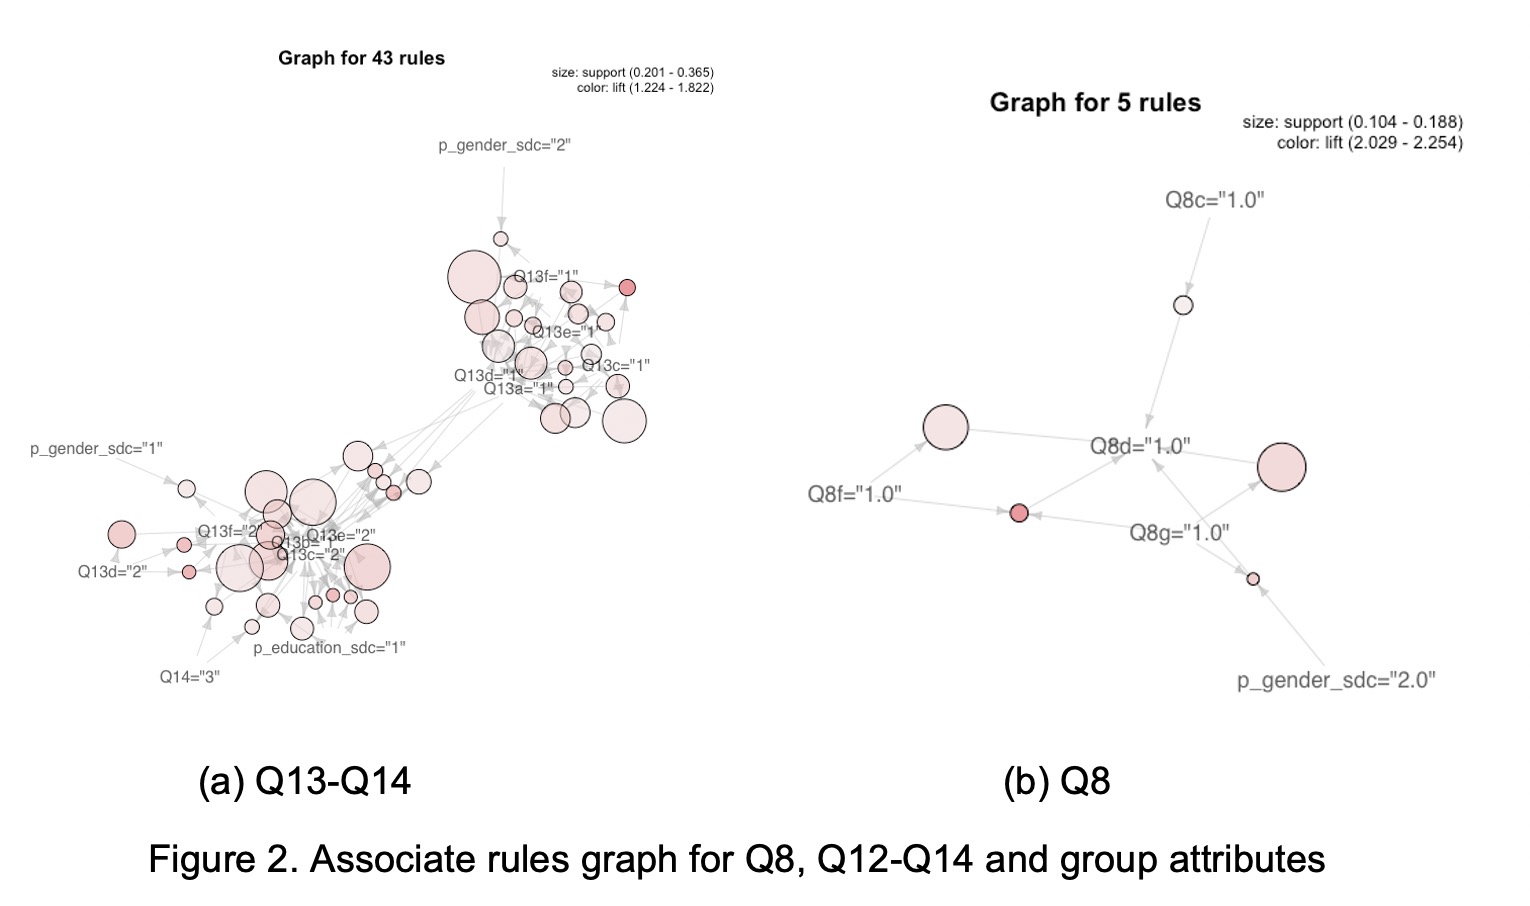
As is shown in the graph, this mining rules concentrate on the Q13 and Q14. Generally, the female (the right cluster) are more likely to answer 1 for Q13 and male (the left cluster) with higher education background, aged 50-64, prefer 2 for Q13 and 3 for Q14. This means that the male would believe the institutions like universities and hospitals would keep their data properly and not expose them to others. In other words, the males have more confidence in the safety of their data.
To find out more rules related to Q8 and Q12, Q3 and Q14 are removed from the input and another round of associate mining is operated. For Q12, there also 0 rules when setting the support to 0.1 like Q6’s situation. For Q8, the mining returns 5 rules, the relevant graph is in Figure 2 (b). It shows that the female would like to answer “1” for Q8, which means that they don’t trust the government or big companies at all. This finding is aligned to 3.2, that female won’t believe the government can use or keep their data properly.
3.4 Mining on attitude towards the of consumer data right
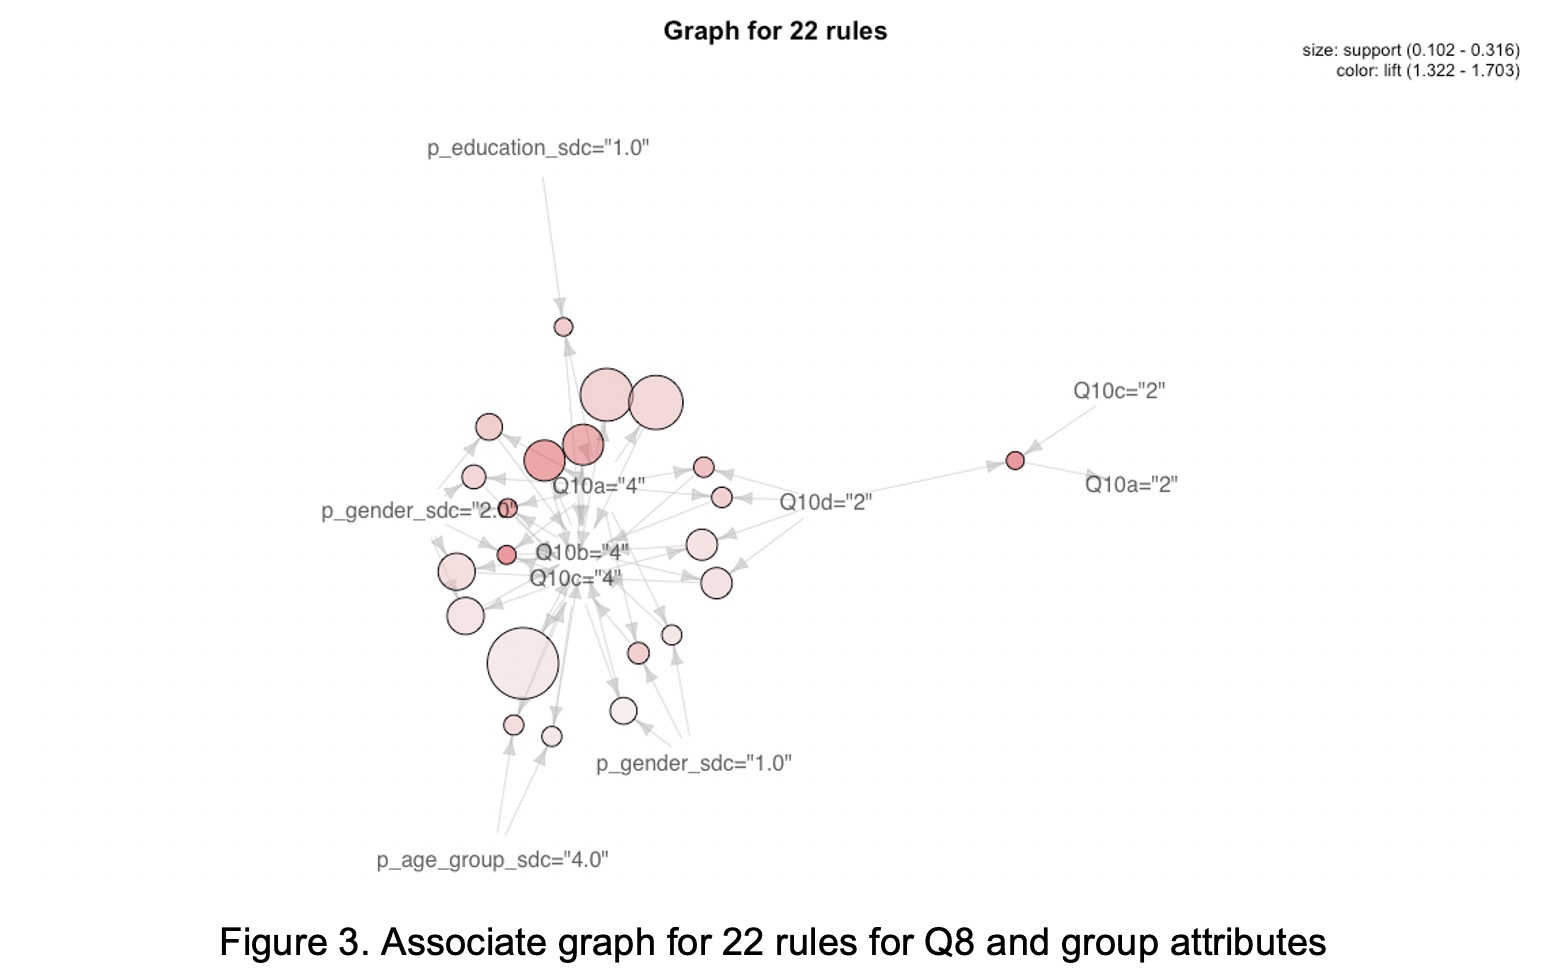
In this section, Q10 and people group attributes would be selected as input and the other attributes would be ignored. As for parameters, the support and confidence are set to 0.1 and 0.65 since previous parameters seem too high. The associate mining on the consumer data right only returns 22 rules and it is shown in Figure 3. In this graph, the females are more likely to answer 4, which means they tend not to have others get access or use their data for receiving better services, but they also refuse to reduce their data online even for reducing the risk of privacy exposure at the same time. Another interesting thing is they are also potentially senior citizen and have a bachelor’s degree or above.
3.5 Discussion
This section uses associate mining to find out whether there is a relationship between the answer and the gender. Generally, the females are more likely not to trust the authority, including governments, research institutions, and big companies and they are unsatisfied with the current situation although their expectations are lower than the males. This finding the previous assumption that both two genders may share the same attitude towards the public authority is wrong. Besides, the females are more sensitive about data security than the males. Moreover, the females are also more likely to choose the strongest answer in this questionnaire, which the males seldom choose according to the mining result. This is also surprising and against the intuition since the author thinks the males may be more likely to provide aggressive answer because of some stereotype. In the following section, the relationship between gender and such an action of choosing strong answer would be further investigated by the technologies of clustering and linear model.
4 Unsupervised learning using K-means to explore the relationship between the count of each answer
The aim of applying K-means is pre-researching the count of each answer (strongly against, neutral, against, agreed and strongly agreed) before training a specific model. Before clustering, each count of answer would be rescaled to [0, 1] to avoid sparsity on the graph. This process is also operated via Rattle. Since the whole report concentrates on the relationship between question and gender, the number of clusters would simply set to 2. If existing a clear boundary between 2 clusters in a graph, it is potentially assumed that such attribute may be related to the classification of the gender.
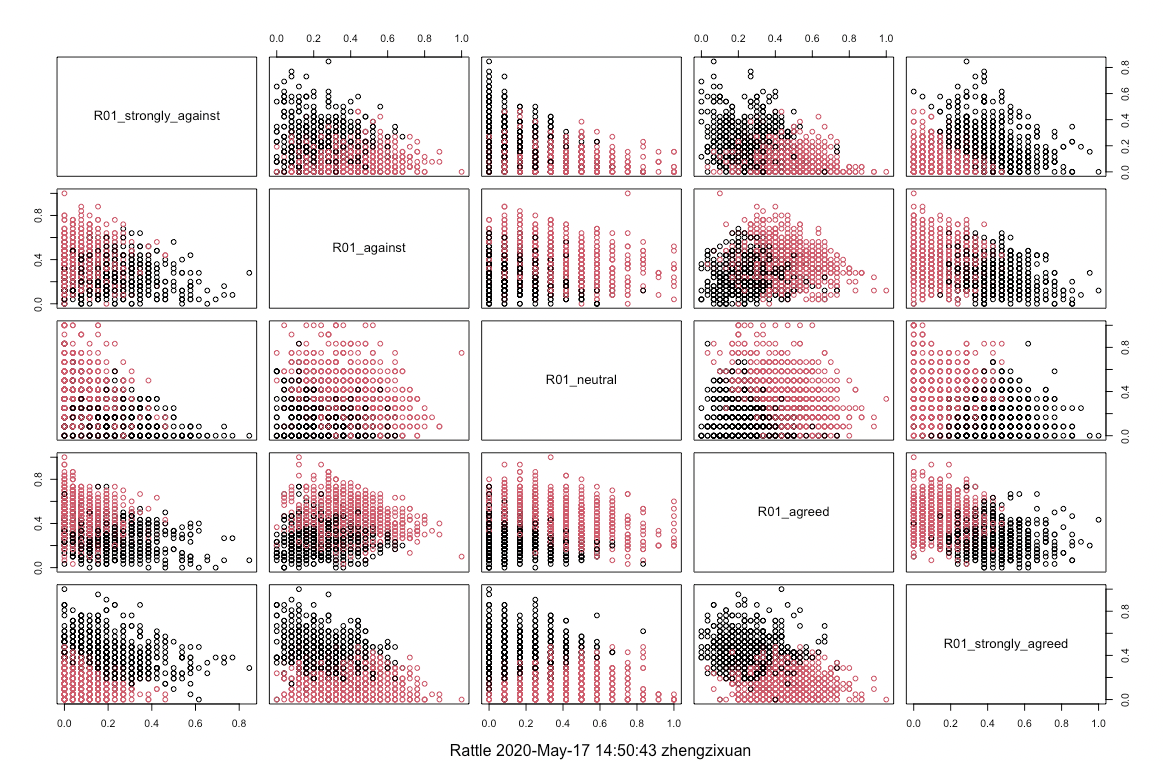
Generally, the combination of strongly against and strongly agreed and the combination of attribute “neutrall” and “strongly_agreed” have a clearer boundary to separate 2 clusters. Specifically, for strongly against and strongly agreed, it is clear that half of the respondents tend to choose very few numbers of such strong answers and meanwhile the other respondents tend to choose much more stronger answers. In the second combination, the graph illustrates that the attribute “neutral” and “strongly_agreed” are mutual repulsive where the two clusters are divided by the diagonal line. This indicates that the respondents would choose either the neutral or the strongly agreed. Based on such findings, the attribute “strongly_against”, “neutral” and “strongly_agreed” would be used for the following section.
5 Supervised learning using linear model to predict the gender based on the count of each answer
5.1 Methods specification
After exploring the relationship between the choices and the gender and the cluster study of the count of each answer, this report would continue exploring whether there’s model can predict the respondent’s gender by the count of each question he/she answered in the poll (strongly against, neutral, against, agreed and strongly agreed). Besides, based on the finding in associate mining, this section would also explore whether the strongest answer has an impact on classifying gender. Specifically, an experiment on eliminating the input attribute “strongly_agreed” and “strongly_against” would be processed to see its effect on classifying the gender of the observation. Generally, this report would use logistic regression to do the classification work.
5.2 Result analysis
For the base case where all input features remain, the partition of the data set to 80/10/10, where more data for training may improve the performance, and random seed setting to 4200 for obtaining a relatively good result. Since the target value includes “1” (male), “2” (female), and “nan” (unknown), the only selection in Rattle is to use multinominal for doing the linear model. The test result is in Figure 5. Then, the attribute “strongly_agreed” and “strongly_against” would be eliminated to see its effect and the relevant test result is shown in Figure 6.
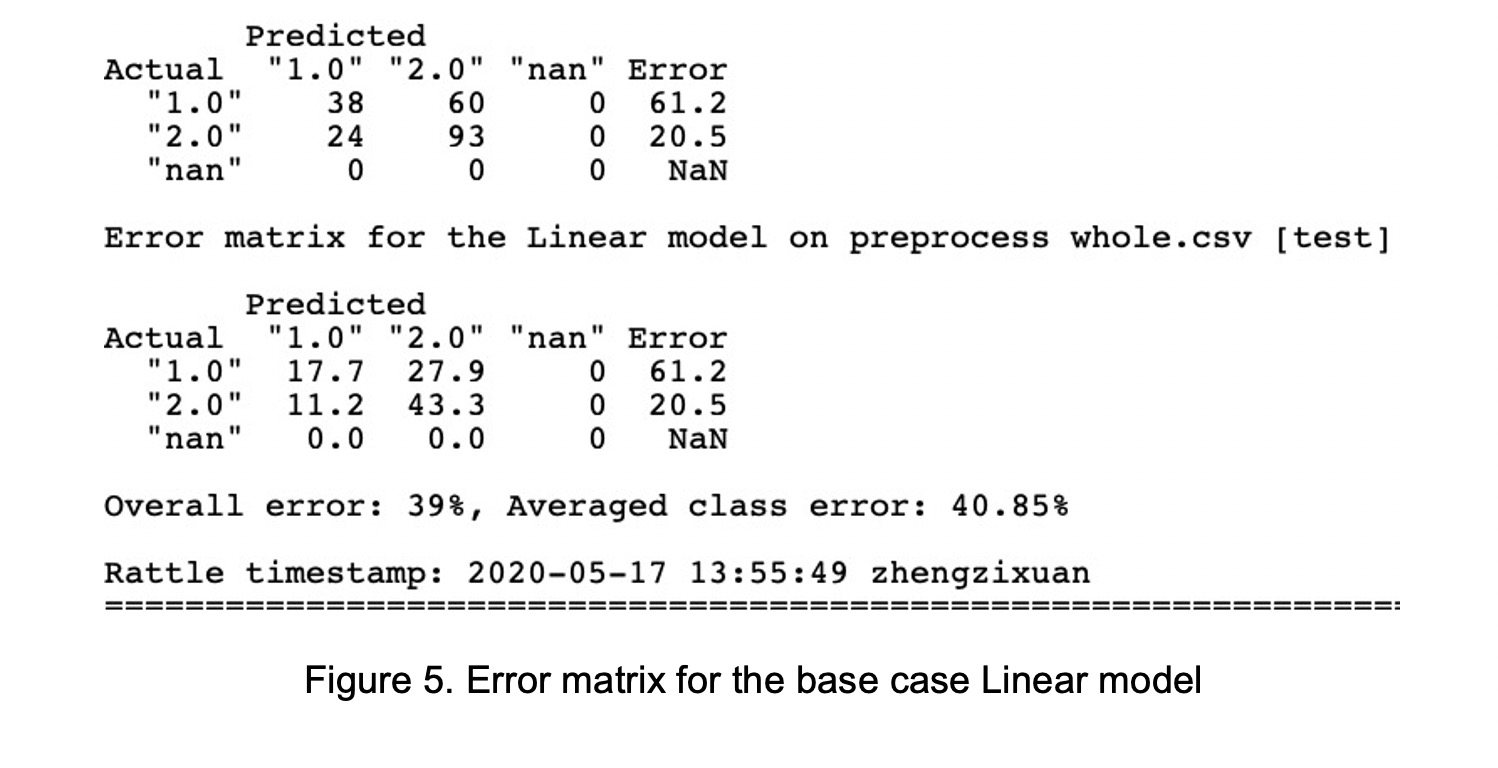
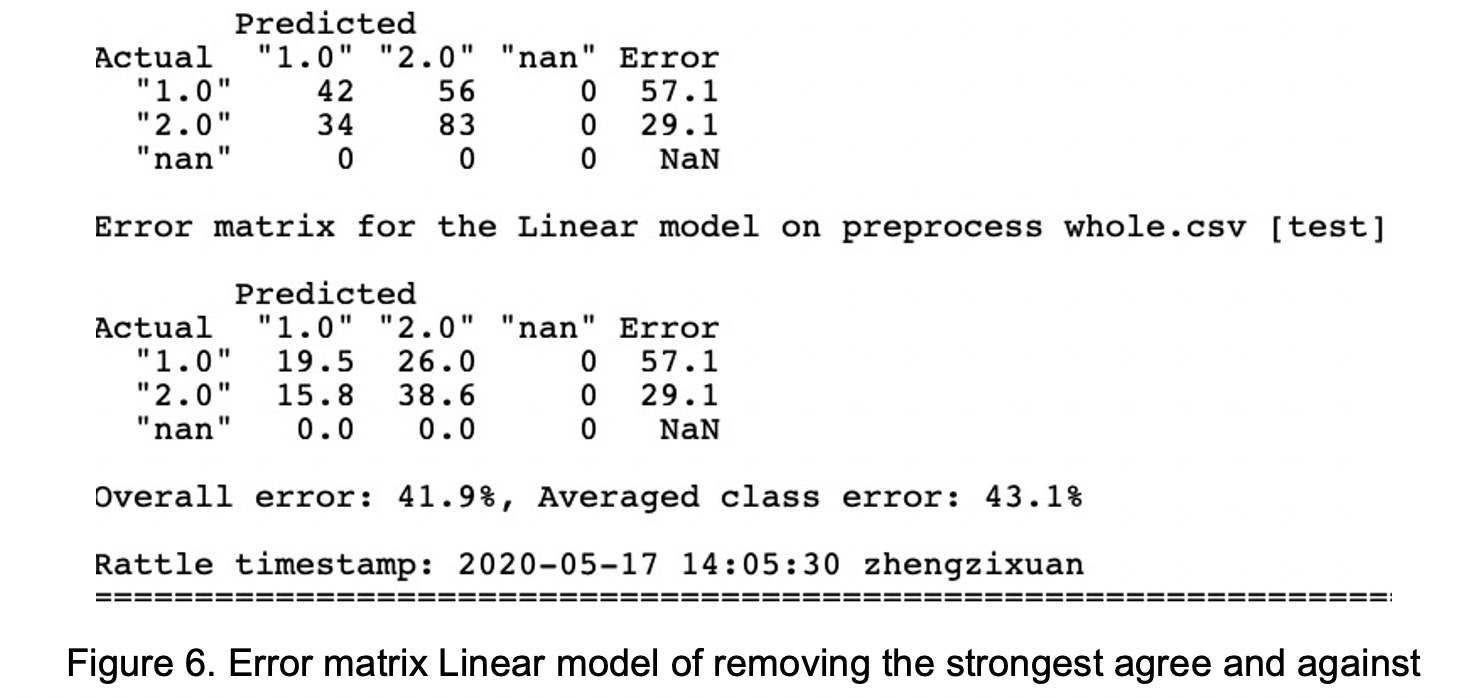
As is shown in the graph, eliminating the attribute “strongly_agreed” and “strongly_against” cause an increase in the overall error and average class error. Especially, the error in predicting the female increase from 20.5% to 29.1%. However, the error of predicting the male decrease from 61.2% to 57.1%. In this case, removing the count of the two strongest answers has a positive effect on predicting the males and negative effects on predicting the females. This also proves the finding in associate mining that females tend to choose a stronger answer in this questionnaire, and they are more unsatisfied with their data security fact.
Another experiment is taken to prove such a point, where the count of “neutral” is removed. The result is in Figure 7 and it shows that the predicting error of male increases from 61.2 % to 71.6% while the predicting error of female only decreases from 20.5% to 19.7%. This means that removing the count of “neutral” has more impact on predicting male, which implies that the females are more likely to give a stronger answer than the males.
6 Conclusion and future work
This report uses the ANU POLL 2019 from [1] to explore whether there is a relationship between gender and the attitude on the data utilisation of authority like government or company. Several methods are used including associate mining, K-means cluster and linear model. The associate mining results show that the female is more likely doubtful on the safety of their data the authority and unsatisfied on the current situation than the male although their expectation may be lower than the males according to the result of data mining. The following K-means and the training of linear model also illustrate that the female also tend to provide stronger answer than the males.
Based on the results, the public authority may reconsider whether there is gender bias in the current policy or mechanism of maintaining the confidentiality and integrity of data utilisation since the females are more unsatisfied with the current situation. Besides, to get more accurate analysis on how and why females have such opinions, further relevant investigation, like what kind of information security accidents they have encountered should be operated and analysed for improving both their quality of life and the security and public trust of the society.
References
[1] N. Biddle, B. Edwards, M. Gray and S. McEachern, “ANU Poll 2018: Data Governance,” 2019. [Online]. Available: https://dataverse.ada.edu.au/dataset.xhtml?persistentId=doi:10.26193/XHORAI.
[2] P. Bell, “Weighting and Standard Error Estimation for ABS HouseholdSurveys,” Australian Bureau of Statistics, 2000.
[3] P. J. Lavrakas, “Encyclopedia of Survey Research Methods,” Sage Publications, Inc., Thousand Oaks, 2008.
[4] J. Han, M. Kamber and J. Pei, Data Mining Concepts and Techniques, Elsevier, 2012.
源数据链接:https://dataverse.ada.edu.au/dataset.xhtml?persistentId=doi:10.26193/XHORAI